This data presents Australia’s small businesses according to their regional or metropolitan area classification, focusing on numbers and locations.
Key findings for the year to 30 June 2023
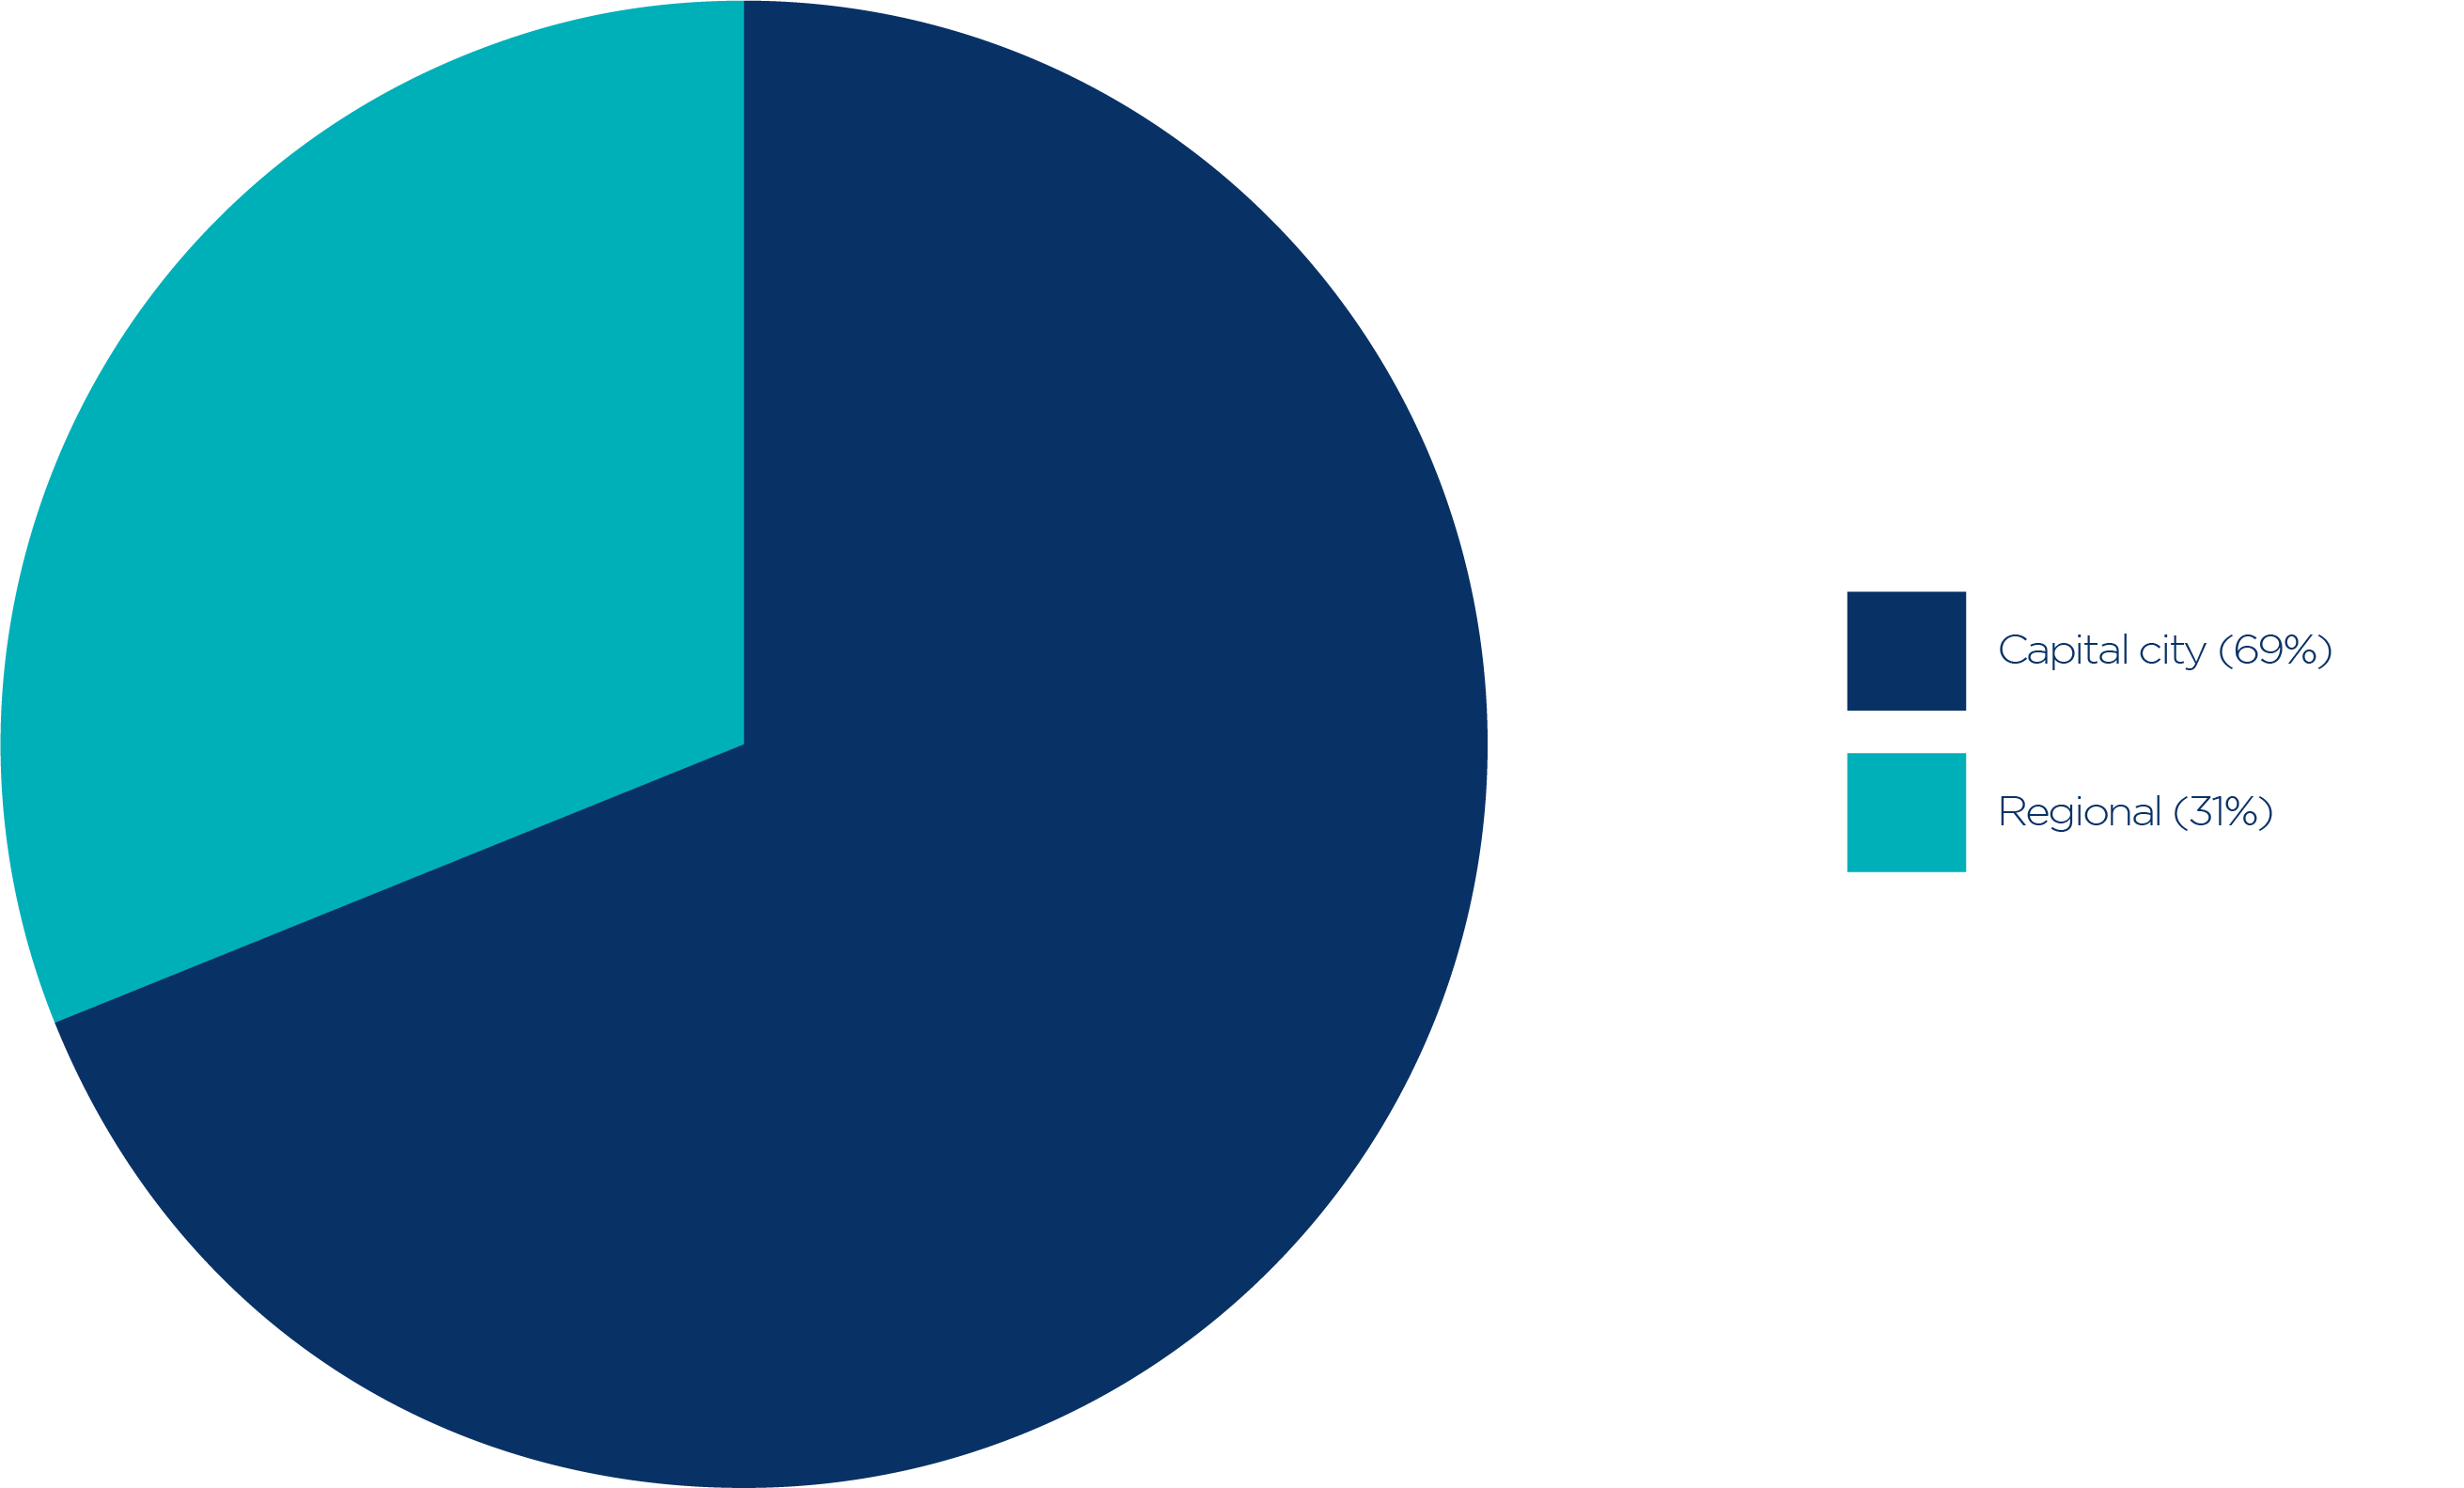
- Of the 2.5 million small businesses in Australia, 69% (1.7 million) were in a greater capital city area and 31% in a regional area. This is consistent with the distribution of the Australian population, with 67% of all Australians living in the greater capital city areas.
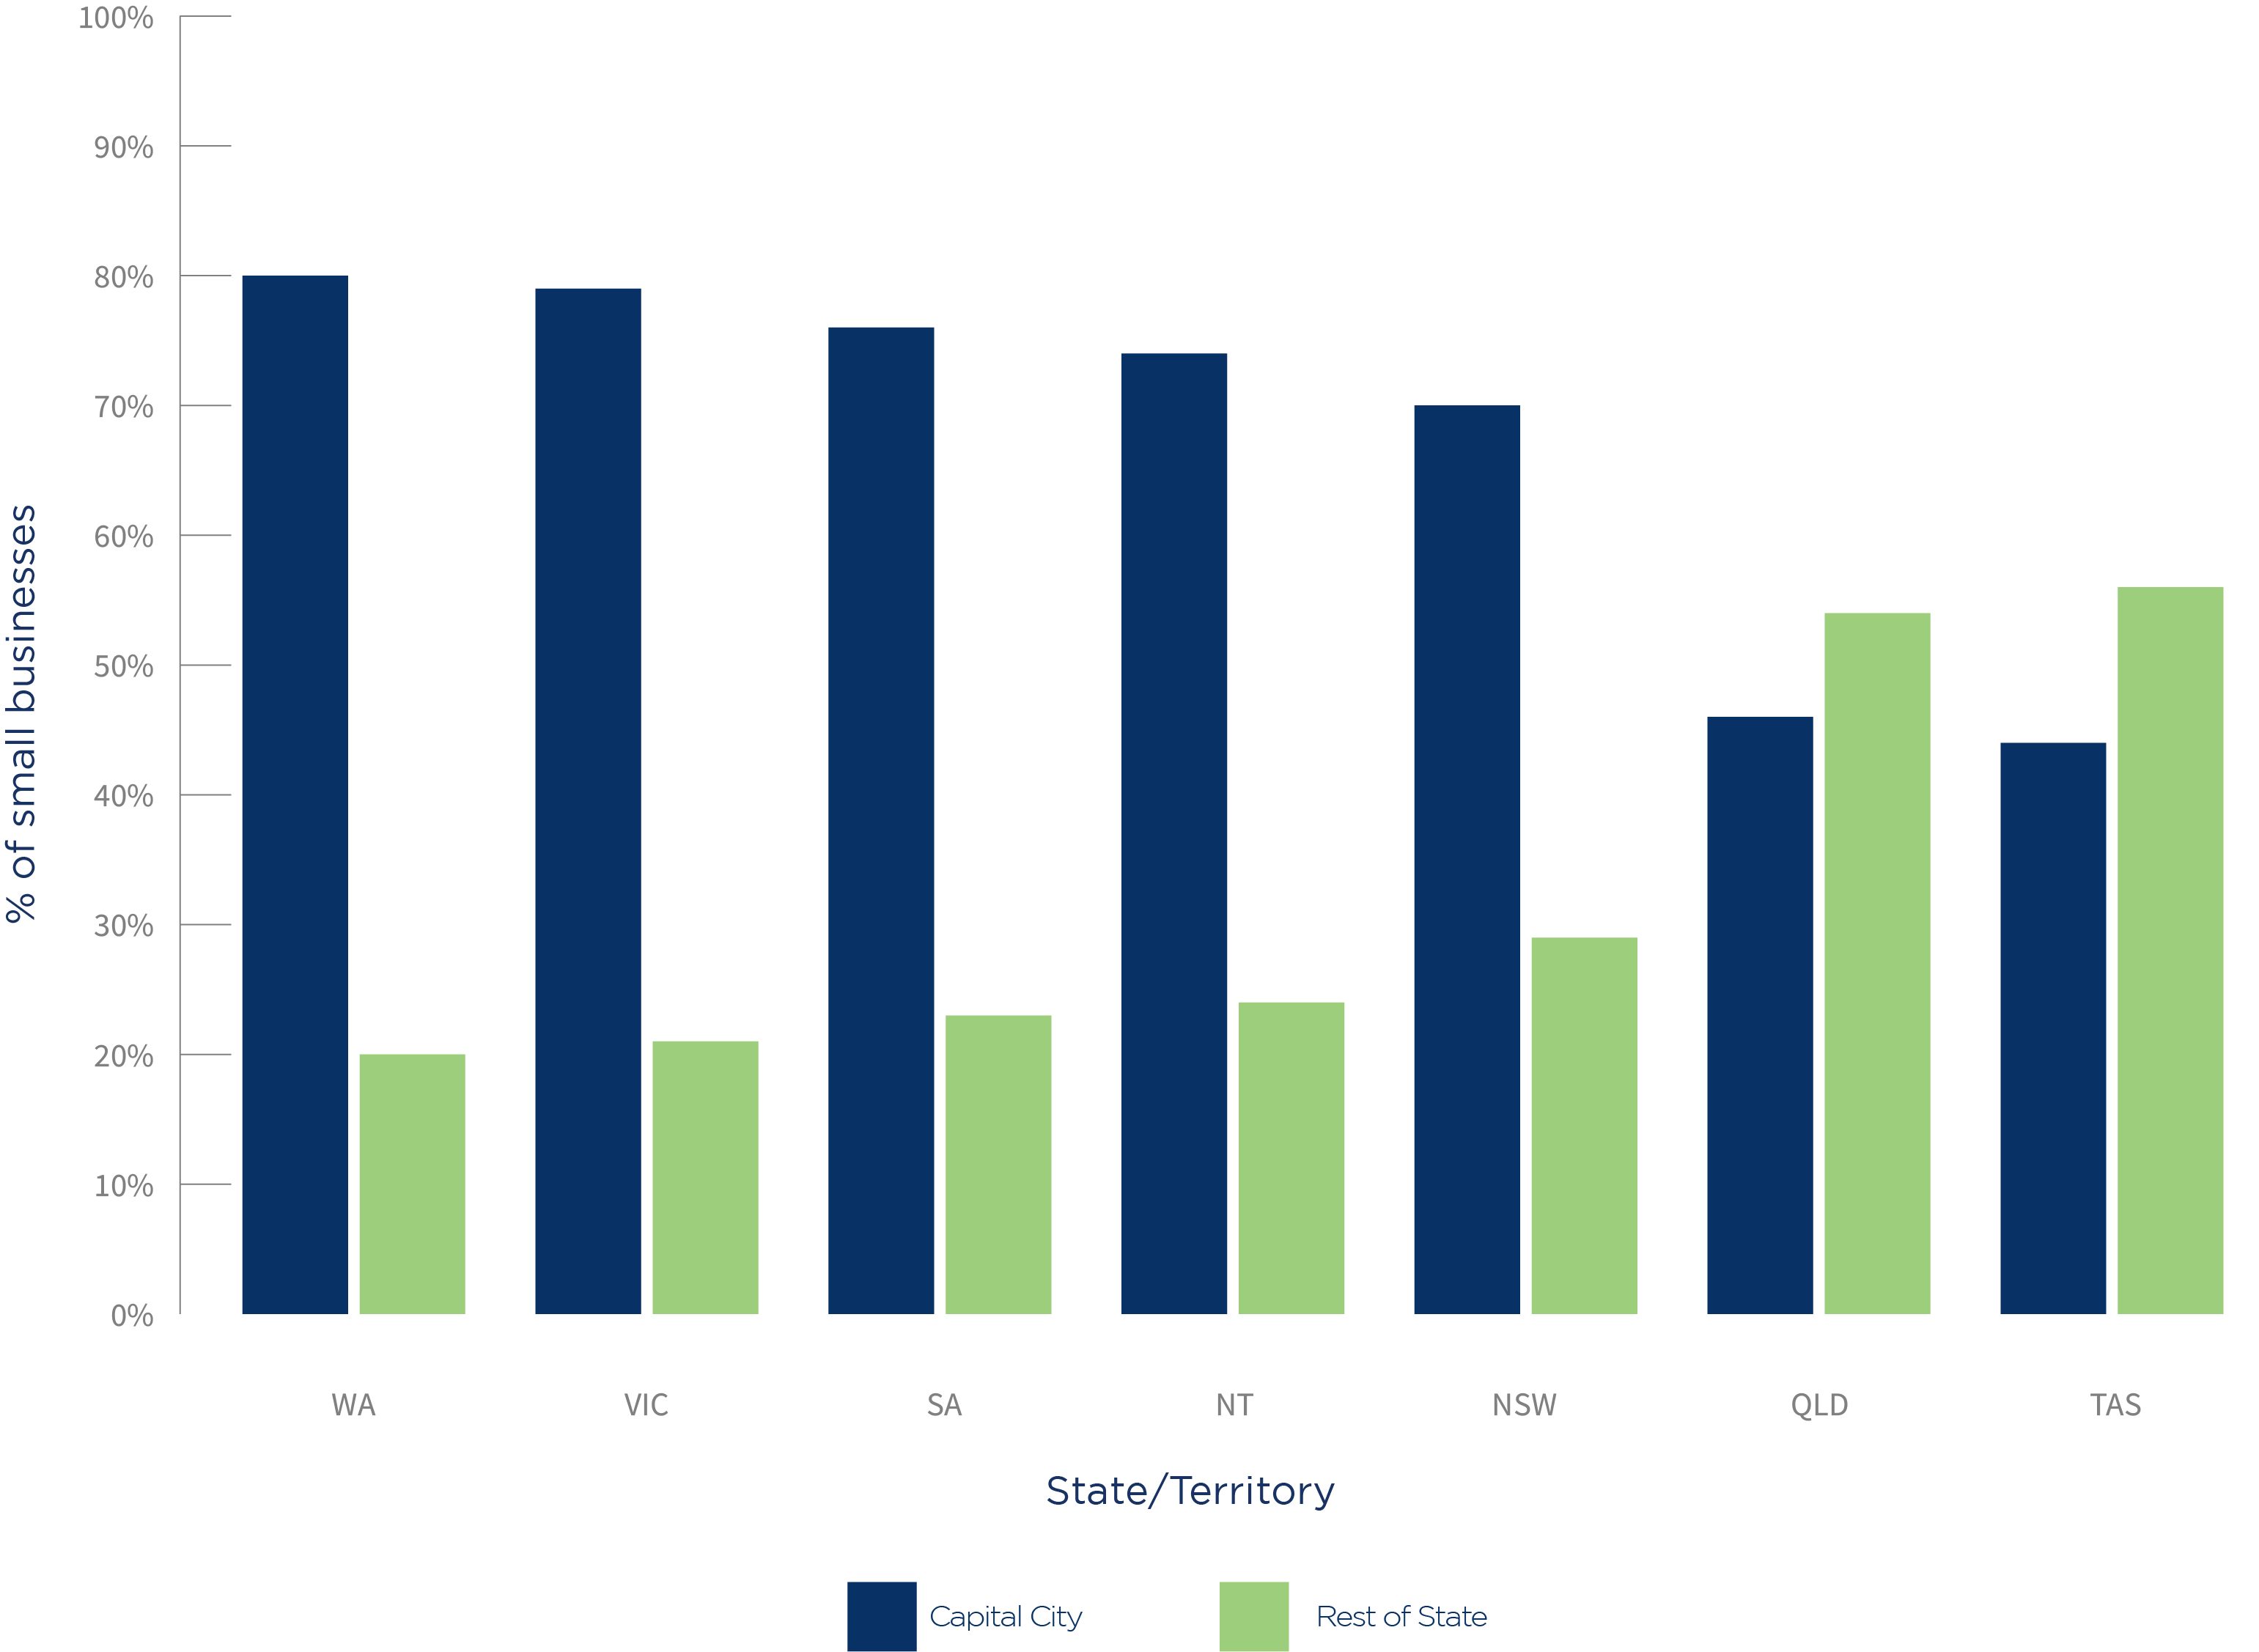
- Queensland and Tasmania are the only states or territories where most small businesses are located in regional areas.
- The number of small businesses increased in all states and territories except Victoria and external Other Territories. Victoria’s decrease can be attributed to a decrease in the number of small businesses in Greater Melbourne. The number of small businesses also fell in Other Territories (Christmas Island, Cocos (Keeling) Islands, Jervis Bay, Norfolk Island).
- The strongest growth (in percentage terms) in the number of small businesses in greater capital city areas occurred in the Australian Capital Territory (3.3%) and Greater Hobart (3.0%) over the year to 30 June 2023. The main contributors to these increases were the Professional, scientific and technical services and Transport, postal and warehousing industries.
- The number of small businesses in regional areas increased in all states and territories. The strongest growth (in percentage terms) occurred in regional Queensland, New South Wales and Western Australia.
Source: Australian Bureau of Statistics, Regional Population 2021-22, Accessed 11 January 2024.
Data notes:
This data excludes businesses not registered for GST. The Australian Bureau of Statistics adjust cells to avoid the release of confidential information, so cells may not add up to totals. Exercise care when analysing small numbers. For further information see Australian Bureau of Statistics, Counts of Australian Businesses, Including Entries and Exits methodology.
Regional areas are locations outside the Greater Capital City Area. Further information on the Australian Statistical Geography Standard is available from the Australian Bureau of Statistics.